

One can get an idea as to how great a concern radon may be in a house by learning about the geology of the surrounding site, along with the area’s radon potential. If a house is in an area with a high potential for radon, then chances are that the house may have an indoor radon problem. However, the way a house is built can increase the risk, so even in areas of low radon potential, some houses can have unhealthy radon levels. Scientists evaluate the radon potential of an area and create a “radon potential” map by using a variety of data.
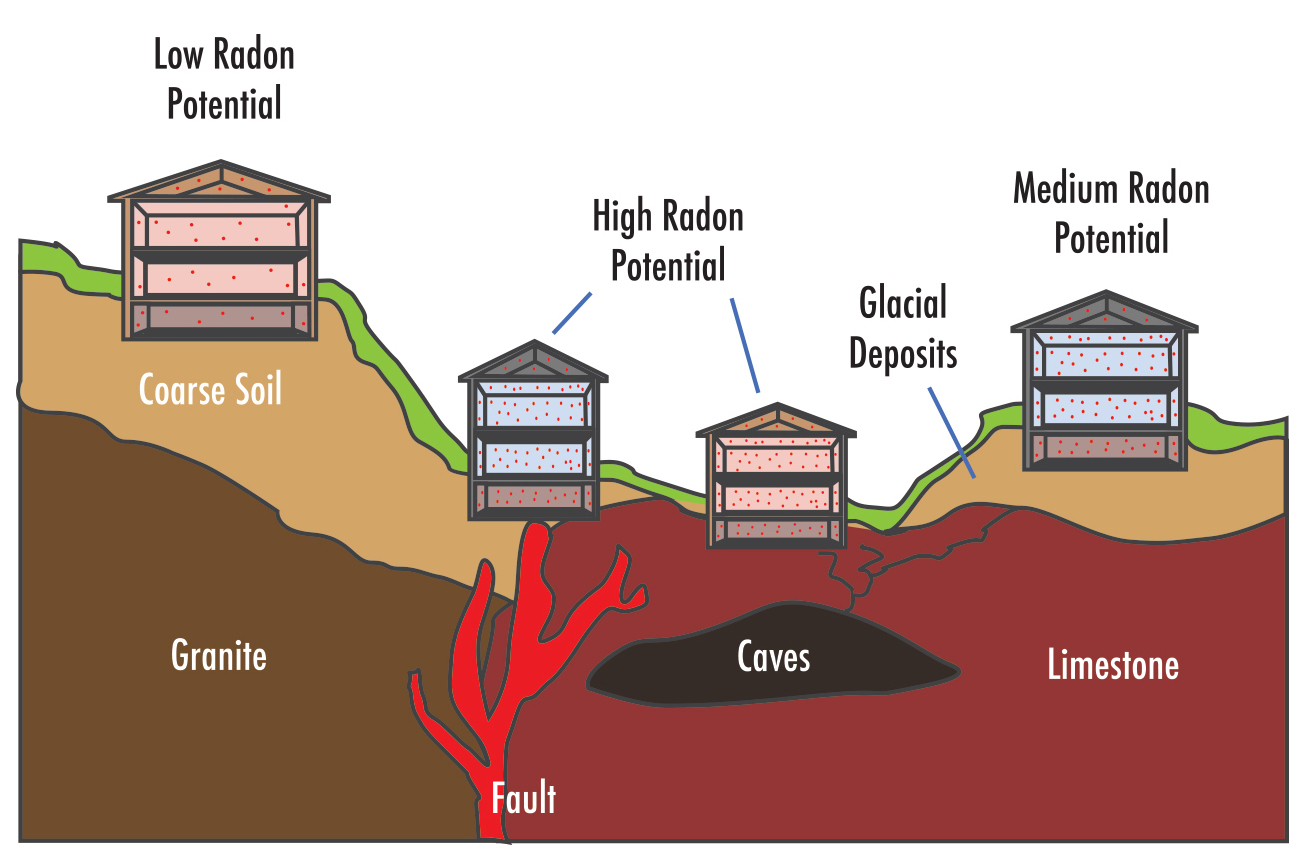
Knowing the types of rock and soil at a site helps a geologist determine its radon potential.
Sources of Information on Radon Potential
Soil Surveys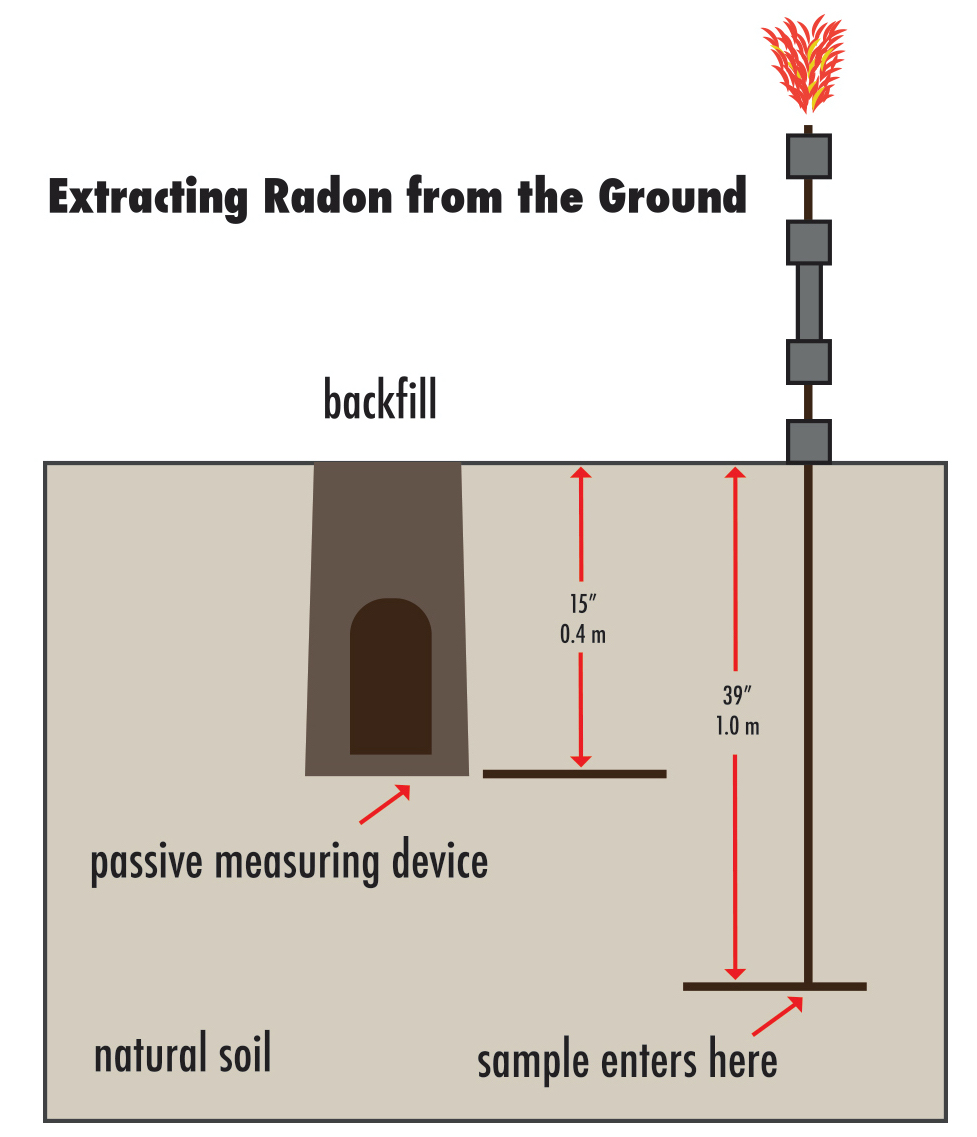
The U.S. Department of Agriculture’s Natural Resources Conservation Service (formerly the U.S. Soil Conservation Service), in cooperation with state and county extension offices, prepares and publishes soil surveys. Other soil data from surficial (or near- surface) geologic and engineering maps are prepared and published by geoscience agencies. Many published soil surveys are available in local libraries. Modern soil surveys include information on the physical properties and permeability data for the mapped soils at varying depths. In older soil reports, no permeability data are given, and soil names and statements regarding internal drainage must be used to estimate permeability.
Indoor Radon Data
State health departments, local agencies of environmental protection, and county and municipal health departments and districts often have data on indoor radon, which they make available to the public in summary form.
Geologic Maps
A geologic map shows the types of rocks and geologic structures in a specific area. Because different types of rocks have different amounts of uranium, a geologic map can tell a geologist the general level of uranium or radium they can expect to find in the rocks and soils in the area. Such maps are especially important in showing where rocks with high levels of uranium occur.
Because radon that enters buildings usually comes from several feet of the earth’s top-most surface, knowing the radon levels of the surficial materials is important. Surficial geologic and engineering maps show and describe these surface materials for many regions of the United States. These maps are useful for understanding the physical properties of the materials at the surface, such as permeability, but are generally not as useful for determining what the uranium concentrations in the surface materials might be.
Local geologic maps are often available at:
- the U.S. Geological Survey;
- U.S. Army Corps of Engineers;
- state geological agencies;
- colleges and universities, and their libraries; • public libraries; and
- county assessors’ offices.
Radioactivity Maps
Radioactivity maps give an indication of the uranium levels of surface materials. The most common type of radioactivity map is an aero-radioactivity map, which is based on radioactivity measurements taken by aircraft flying at low altitude using instruments that measure the radioactive energy being emitted from the ground.
There is a strong correlation between areas identified on aero-radioactivity maps as having high levels of surface uranium and areas for which high levels of indoor radon have been reported. In some parts of the country, swamps and marshes are abundant and, in many of these areas, the soils at the surface are full of water, which blocks the radiation of energy. The average amount of radiated energy detected for these areas is lower than it would be if the soils were dry. The uranium content of the soils and the radon potential are likely to be underestimated in these areas.
A large amount of aero-radioactivity data was collected as part of a U.S. Department of Energy program to evaluate the uranium resources of the United States. Most of the energy detected during these flights was from rocks and soils within 800 feet of flight lines that were spaced 1 to 6 miles apart. Many major metropolitan areas were not covered by the survey because of flight restrictions. Therefore, only a small part of the entire surface of the United States was measured. The data from this survey, however, give a good indication of the background uranium concentration of soils and rocks underlying most of the United States.
The digital data from the survey were processed by the U.S. Geological Survey to produce a map showing the uranium content of surface materials in the contiguous United States (the lower 48 states). The smallest data point on the map covers an area of about 1.6 square miles, limiting the amount of detail that can be seen. It is possible to tell how parts of a region, a state, or even a county vary in surface uranium concentration, but it’s impossible to tell how the presence of uranium varies from neighborhood to neighborhood or from house to house. The U.S. Geological Survey and state geological agencies prepare and publish radioactivity maps.
Soil-Air Radon Data
Scientists also measure radon in soil air. Data on this give direct evidence about soil radon, but extensive numbers are not commonly available. The two basic methods for measuring the radon concentration of soil air are the same as those used to measure radon in buildings. Both methods measure the alpha particles produced by the decay of the radon in the air.
One method involves burying a passive device (such as a charcoal canister or an alpha track detector, in the soil) and leaving it open to the soil air. This method allows long-term measurements, but the devices can be strongly affected by soil moisture. In the other method, a sample of soil air is collected from a probe driven into the ground, and the radon in the sample is measured by using electronic equipment. This method provides data quickly, but these short-term measurements may vary greatly due to daily, weekly, and even seasonal changes in soil and atmospheric conditions that are averaged out during long-term measurements.
Soil-air methods require specialized equipment because soil-air data are sensitive to many conditions and factors, such as the depth of measurement. Radon levels differ widely in the top 2 to 3 feet of soil because of variations in soil moisture and the amount of radon that escapes into the atmosphere. Taking measurements at 3 feet or deeper avoids many of the problems related to near-surface conditions, but this may be difficult in some soils.
Indoor Radon Data
Indoor radon has been measured in many houses, schools, and commercial buildings across the United States. For the most part, these measurements have been made by homeowners using passive detection devices. Radon concentrations in some homes and businesses are measured by private companies as part of real estate transactions. Many local, state and federal agencies measure radon in buildings for which they are responsible.
Most indoor radon measurements are confidential transactions between homeowners and measurement vendors. The data from these private measurements are not generally available to the public. When they are available, the data are usually given as summaries by state, county or ZIP code. Nonetheless, these summaries are useful in determining which areas of the counties, states, or entire regions of the United States seem likely to have elevated indoor radon levels.
By careful examination and correlation, scientists can evaluate the effects of varying geology and soils on actual readings of indoor radon. The indoor radon information can be used as an additional aid to create a radon potential map, or it can be used as a way of expressing the radon potential of areas mapped by the geologist. However, differences in house construction can also contribute to variations in the indoor radon levels.
Radon Potential Maps
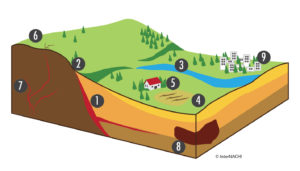
Scientists create radon potential maps by combining a variety of data, such as the locations of rocks containing high levels of uranium, locations of fractures, aero-radioactivity data, soil data on permeability and radon content, and indoor radon data. Not all of these types of data are available for every area, and radon potential maps for different areas may vary if they are based on different types of data.
Evaluating Radon Potential
Again, by knowing something about the geology and soils of the area, scientists can evaluate the radon potential for the rocks and soils of housing sites and areas of interest.
Evaluating radon potential
These factors can increase the probability that an area will have above-average areas of radon:
- Uranium-rich rocks occur in the area.
- Highly permeable soils are present.
- Soils are well-drained or dry most of the time.
- Soils form deep cracks during dry times of the year.
- The site is located on a hill or slope.
- The soils are thin, and bedrock is close to the surface.
- Underlying rocks are fractured.
- The underlying rock contains limestone caverns.
- High levels of indoor radon have been reported in the neighborhood or county.
In conclusion, there are various resources one can use to get an idea of how great a concern radon may be in a house. Typically, the process includes assessing the geology of the surrounding site and the area’s radon potential. A “radon potential” map is often created in the process using various sources of information about radon potential discussed above.